Trávník's smooth self-referential formula - Detailed explanation of formula functions and format of the N number
Go back to main page on Trávník's smooth self-referential formula.
Self-referential formulas are most easy to build using what I call "anything formula". This is to contrast "everything formula" a term popularized in this youtube video on Numberphile channel.
Graphs of everything formula contains everything, you just need to find right viewport to get interesting picture.
Tupper's formula is a concise "everything formula". There are some constraints on x and y coordinates indicating where you should draw it. The formula can be used to draw picture which contains the formula itself (constraint on coordinates will not fit though). One of the constraints is 0 ≤ x < 106, that is quite ordinary. The other constraint contains suspiciously big number, N ≤ y < N+17, where N is a 544 decimal digit number. Without this constraint on y the formula is "everything" formula. This "everything" formula displays every bitmap that could fit into 17⋅106 pixels. It displays them all together, each next to other in Y direction.
Anything formulas
Unlike "everything formulas", these do not display everything at once. The "anything formulas" have a parameter that tells what to display and they don't display anything else.
In my self-referential formula from 2011 I have used a function "g" that can draw anything. It depends on parameter "t" and it can display anything that fits a "a⋅b" bitmap, but it displays only that thing for particular "t" value. My g, the "anything function" was inspired by Tupper's "everything function" (the part of formula without inequality) and you can probably see some similarities.
You can usually change "everything formula" into "anything formula". Perhaps by adding some big number into formula or constraints. The number that selects particular image you want. Or you can create new anything formula from scratch.
Anything formula for smooth curves: Trávník's anything smooth formula
This is the formula I have created as building block for my new self-referential formula. It displays anything depending on parameters where this anything is a black and white image (black and white is decided based on whether inequality holds or not) composed of areas outlined by cubic Bézier curves. There is no self-reference at this point, but it is a building block for self-reference.
Quadratic Bézier curves are the simplest, but cubic Bézier curves have advantages for designing glyphs so I wanted to use cubic. Cubic Bézier curves have four control points. You read excellent tutorial on Bézier curves here: https://pomax.github.io/bezierinfo/
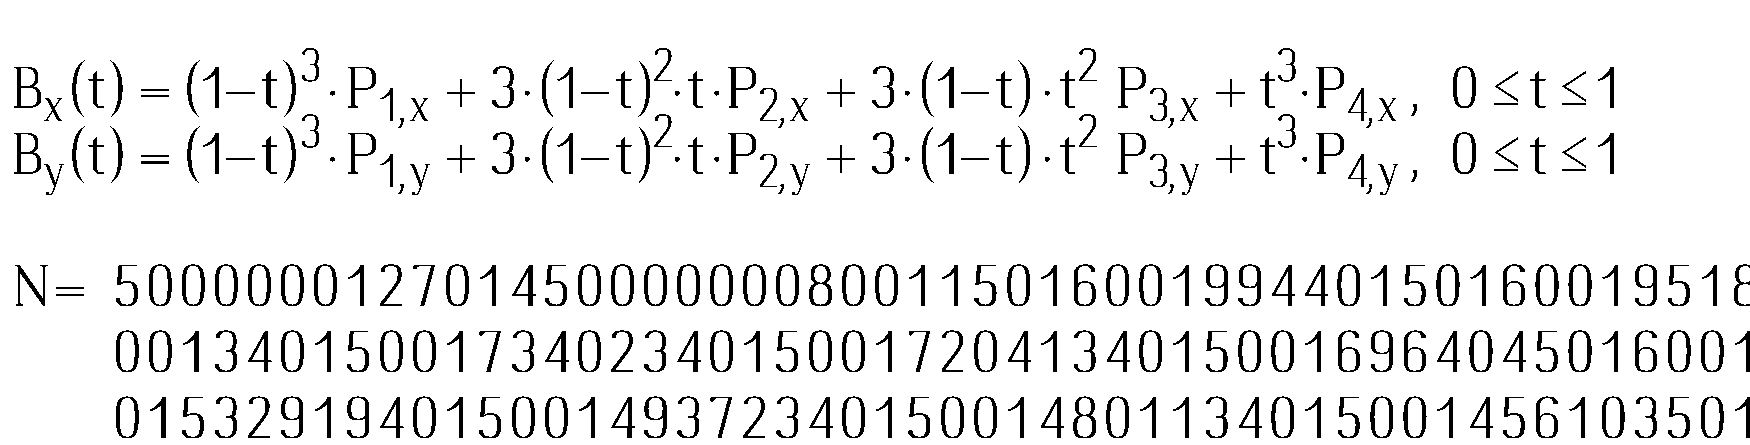
Most popular way to evaluate Bézier curves is to use their parametric form, for cubic curve this is:
where P1 to P4 are control points. I have used this form of Bézier curves initially (see section on formula development). But in my anything formula a different way is used.
There are several recursive functions involved. The ones starting with W letter are related to computation of a winding angle of single cubic Bézier curve for a specific (x, y) point. Winding angle is related to a winding number. Functions used here use winding angle in radians. Winding number is integer representing number of full turns so winding angle of 2π radians is winding number of 1. See https://en.wikipedia.org/wiki/Winding_number for details on winding numbers.
For connected curves defining outline of a shape a winding angle is 2π if curve goes around that point in one direction full circle single time. It could be -2π if it goes in other direction, i.e. the curves are oriented. It could be integer multiple of that if curve goes over multiple times.
These winding angles are added up in function Evs which goes over several curves encoded in number k (function Sel selects parts of the k number to get coordinates for control points of Bézier curve). The orientation of curves is important when there are multiple curves used. To use multiple curves to create a shape using its outline, all the curves along the path of outline must have same direction. Also they should be connected. If they are not connected, then for winding angle will not be a 2π multiple. The formula inequality uses absolute value of added winding angles to be greater then π (treshold in the middle between 0 and 2π) which makes it tolerant if part of outline connection is missing.
The winding angles also allows designer to create holes in shapes by having another set of connected curves, just going in opposite direction (counter clockwise vs clockwise). This is very useful to create letters like creating an O letter from one set of curves creating outer shape and another set of curves going opposite direction to create inner shape.
The way the winding angle is computed is using recursive splitting of curves. To compute winding angle, the Wb function uses bounding box computed in Wa. Parametric Bézier curves with parameter t are for 0 ≤ t ≤ 1 completely contained inside polygon defined by control points. So if specific point S for which we would want to compute winding angle is outside of this bounding box, we can just compute winding angle by computing angle between S-P1 and S-P4 using atan2 function (https://en.wikipedia.org/wiki/Atan2), that is the easy part. If S is inside bounding box, there is an option to split Bézier curve into two which makes it likely that S is no longer inside of bounding boxes of the resulting curves. This happens in the Wc function in "else" branch. If the S is directly on the curve, this recursion would not terminate. To ensure termination of computation there is an epsilon parameter. If bounding box is very small, smaller than epsilon then π is returned (there is a better way to do this, but equation is more complex, see in section "The limit and role of epsilon"). Curve spliting is quite easy with Bézier curves, see here: https://pomax.github.io/bezierinfo/#splitting
Trávník's anything smooth formula is complete here:
Funcition Ev just expresses limit over epsilon values: the smaller epsilon is, the finer rendering will be result. Practically, it is just enough to choose small eps for particular magnification (viewport) and display density. See section "The limit and role of epsilon" for details on choosing epsilon. Limit is not defined on the edge of outline, but that is not a big problem for displaying pixels.
The last part is inequality: Ev(x,y,k,p,g) > π
We will paint black where inequality holds, white where it does not. Now we can encode some curves using k, p, g constants and compute inequality for a point by supplying x and y. The picture is drawn inside 0 ≤ x < 1 and 0 ≤ y < 1.
Constants k, p and g encode the set of Bézier curves the formula graph will show. Each has 4 control points, each point has two coordinates, each coordinate is a number between 0 (inclusive) and 1 (exclusive). Constant g tells how much we partition space between 0 and 1. For example with g = 10, the coordinate will be represented by one decimal digit. Its value will be 0.0, 0.1, 0.2, 0.3, 0.4, 0.5, 0.6, 0.7, 0.8 or 0.9 (this is transformation from digit to real number happens in Sel - the function that selects digits from k). Number k is human readable when g is of value 10i, i is integer, i >= 1 because then we can easily take apart i digits of k to get coordinates. The constant p tells how many curves are there.
Let's design a heart symbol
The g = 10 is enough. Two cubic Bézier curves are enough so k = 2. Now we need to draw design:
The first curve is:
p1x=0.5 p1y=0.3
p2x=0.1 p2y=0.5
p3x=0.3 p3y=0.9
p4x=0.5 p4y=0.7
The second curve is:
p1x=0.5 p1y=0.7
p2x=0.7 p2y=0.9
p3x=0.9 p3y=0.5
p4x=0.5 p4y=0.3
Let's compose it into constant k. An order in which we will want to encode single curve is:
⌊p1x⋅g⌋⋅g0 + ⌊p1y⋅g⌋⋅g1 +
⌊p2x⋅g⌋⋅g2 + ⌊p2y⋅g⌋⋅g3 +
⌊p3x⋅g⌋⋅g4 + ⌊p3y⋅g⌋⋅g5 +
⌊p4x⋅g⌋⋅g6 + ⌊p4y⋅g⌋⋅g7
This will get us: c1 = 75935135 for first curve and c2 = 35599775 for second. We can just put them together c1 ⋅ g8 + c2 to get:
k=7593513535599775
p=2
g=10
With these values the anything formula above will paint (in area 0 ≤ x < 1; 0 ≤ y < 1):
The Cat Formula
Let's try something more complex. The g is 1000 here to allow for better precision. There are 66 curves in this number, it contains 66⋅log10(g)⋅8=1584 digits:
k=8500758500757091017091017501757501758500758500757502997632487632237501758513838513837502997502997183617183
  6185138385138355835861239168940271836155809943518643426555835870910168406861706355809963526966527966530964
  5319645319615314610279635269645140665150665180635190635190610180615145645140620159630175650179660164660164
  6551506251456201596202996303096503096602946602946552846252796202995752595752595753795524155504145703745712
  6057126055241555241555041455041457126057126057525957525956526056526056036952741552541455536456126056126052
  7415527415525414525414561260561260565260565260554259554259550359499414497413545359550258550258499414499414
  4974134974135502585502585542595542595520435750795751995751995711985711985700845500445500445500445520435520
  4357519957519957119857119852704356009056519856519856119856119855509552504452504452504452704352704356519856
  5198561198561198499044550100554199554199550200550200545100497045497045497045499044499044554199554199550200
  5502005892106002165992435882485702325682315672295672295822435892375782295702325882485882485832455822435842
  1558521458921058921057022757722958922258421556722956722956822857022753419453520853622455922955022953322353
  0206534194534268530249535235550229559229539233536247534268100264230284356265463235463235468269495310525333
  5253334624014757191477020712460702140992211002642393210952960713180712461003341493401993302393210713160702
  8509929110033420738109537107139307131619253419253428238920738110455611651215950219253407650507647611347010
  4556101693054730075557076505101907195830073814101693147703101752218881122919122919097931092915101907
p=66
g=1000
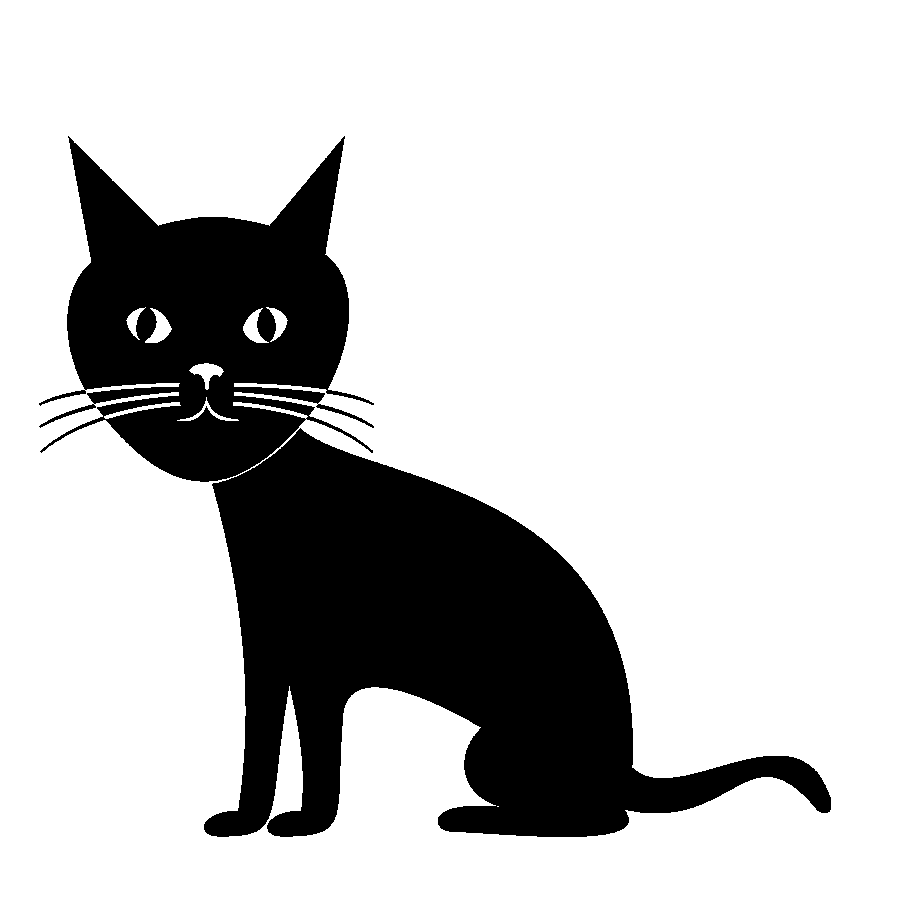
These numbers together with my anything formula (as above) lead to a graph of a cat:

See cat image in higher resolution.
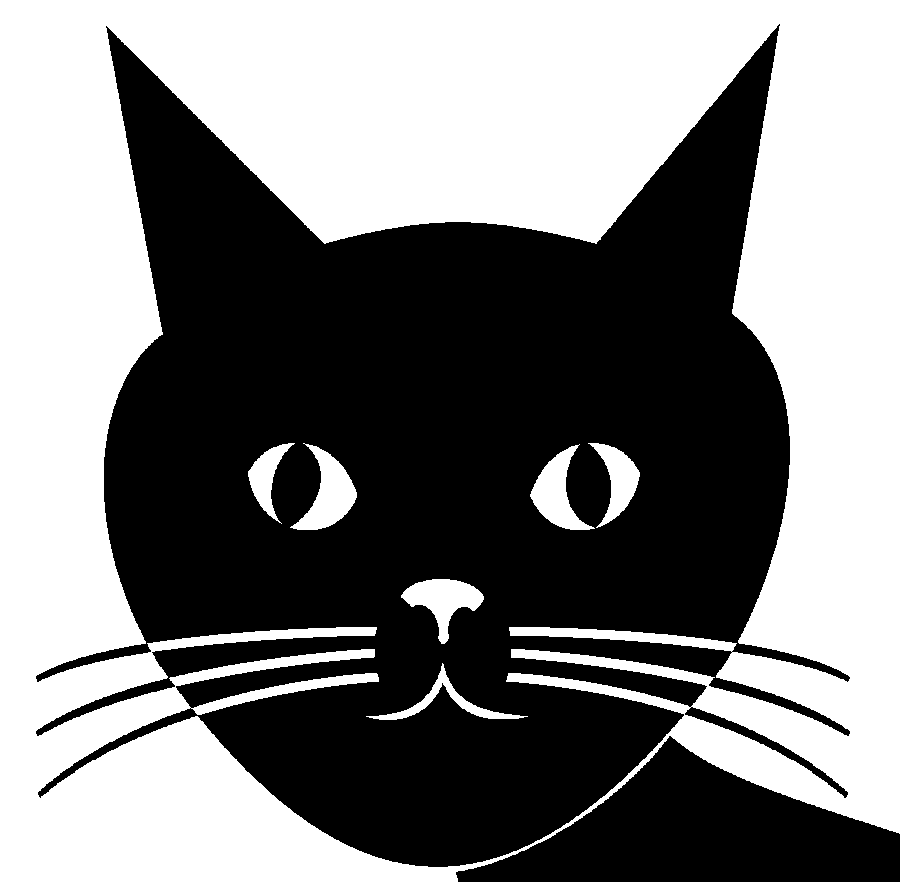
See cat image magnified in higher resolution.
See screenshot of my editor where I created the cat which shows some of the curve control points.
There are other anything functions that can draw anything that are also not bitmap based. Here is a youtube video showing Fourier series can be used to draw arbitrary shapes.
Trávník's smooth self-referential formula
To understand how formula works it is perhaps most important to learn how information about formula is stored inside the N number. The rest is easy, the trick is in Sr function which combines: the printFormula function which interprets N to print formula itself and the printN function which ensures every digit of N is turned into glyph at correct position. PrintN relies on the fact that glyph 0 to glyph 9 are glyphs of digits. Order of other glyphs is not relevant assuming they are properly referenced. The way I generated the N all the glyphs/characters that I created but that are not used by formula are omitted so it is not like, say an ASCII table where glyphs for letters are ordered. Only numbers are ordered and at glyph index 0 to 9.
The format of number will be described in terms of index of digits. Index 0 is rightmost decimal digit, also the least significant decimal digit. Index i is corresponding to 10i.
Example: for N=889234929, index 4, 2 digits = 23.
                  ^^
In other words, N divided by 104, take 2 least significant digits. To take digits apart there are functions Dig and Sel. There is a difference between Sel function in Anything formula and here. It has been specialized to g=1000 here. The Dig is general function to extract a block of digits from a number. The Sel specialized function to get coordinates for control points of curves. The Sel takes a block of 3 digits and uses it to return rational number between 0/1000 and 999/1000 suitable as control point coordinate.
You can get full N in text file here. The N ends with [...]016016800117600816006240043285.
The last two digits are 85. They indicate there are 85 glyphs in a font. Then they are followed by an index table. Index table contains 5 digit numbers indicating where in the number particular glyph curves are located. So curves of the first glyph (glyph 0) starts at index 00432. The curves of the next glyph (glyph 1) starts at 00624. The difference can be used to tell how many curves are contained in glyph 0. Difference is 192. Each curve has 24 digits (3 digits per coordinate, 8 coordinates, nothing more). So 192/24=8 curves are in glyph 0.
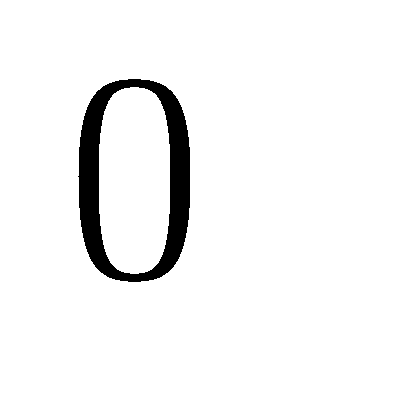
If you would want to see glyph 0, just use anything formula few pages up and plug this 192 digit number (index 432 inclusive to 624 exclusive of N from self-reference formula) as k:
k=2973352972403421955601955552453472453172753173353173353173953474255554255604753424752974302973357833357832
  75753245555245555425753425783395783335803335803430758475560475560195758195803240803335
p=8
g=1000
Graph it for 0 ≤ x < 1, 0 ≤ y < 1.
Function Evse (think se=start-end) computes number of curves based on start of glyph and end of glyph (start of another). To support this, there is one extra index entry for non-existent glyph 85 which just points to a start of typesetted data and helps to identify end of glyph 84. The value L in formula corresponds to start of typesetted data.
Typesetted data are blocks of 13 digits. Digits include (from lower index to higher):
| index | data |
|---|---|
| 0,1 | Glyph number |
| 2,3,4,5,6 | x⋅1000 |
| 7,8,9,10,11 | y⋅1000 |
| 12 | scale digit s, scale = 1.25(s-5) |
Example (left most block of 13 digits of N): 5000000127034
Decoded: Glyph 34, x=01.270, y=00.000, scale = 1.25(5-5) = 1.
Number can be pictured as this:
[typesetted glyph 1681] ... [typesetted glyph 0] [curves of glyph 84] ... [curves of glyph 0] [index of typesetted glyph 0] [glyph index 85 - points to typesetted glyph 0] [glyph index 84] ... [glyph index 0] [glyph count = 85]
Statistics
The N is 50930 decimal digits long. Of those:
- digit index 0 to 1 is used as number of glyphs = 85,
- digit index 2 to 431 are used as glyph index, each index is 5 digits, the last value indicates end of previous glyph (exclusive) and also start typesetted data.
- digit index 432 to 29063 are used as curves of glyphs, 24 digits per curve, 1193 curves, about 14 curves per glyph on average,
- digit index 29064 to 50929 are used as typesetted data, 13 digits per typesetted glyph, 1682 typesetted glyphs.
Use of self-referential formula with different numbers
Self-referential formula can be used with different number. Of course, once you do that its graph may no longer correspond to self-referential formula.
Here is an example. With this N that has only 9469 digits, it paints Bézier polynomial as I have used at the start of this page. I have also included "N =" part as otherwise the number would appear out of nowhere. Link to this N. In this N there are 24 glyphs used in 127 typesetted glyphs. Plot for 0.8 ≤ x < 22, -1.4 ≤ y < 4, no anti-aliasing:
Self-referential formula without printing the number
You can also modify self-referential formula by removing printN part so it will just plot typesetted data without printing the number. This is different to anything formula above: the anything formula just plots all the curves in the number, while this modified formula still uses glyphs defined by curves. If you would like to have formula for a graph with "a" letter displayed 30 times you would be better off with using such modified formula. It would have 2 digits for describing that single glyph is inside, 5⋅2 digits for describing index of where glyph starts and ends, in my font the "a" letter 23 curves so 23⋅8⋅3 = 552 digits, then there would be 30 typesetted glyphs taking 30⋅13 = 390 digits. Total: 2 + 10 + 552 + 390 = 954 digits.
Compare that to anything formula which does not provide this way of compression. Anything formula can only plot in 0 ≤ x < 1 and 0 ≤ y < 1 while self-referential formula places glyphs in 0 ≤ x < 100 and 0 ≤ y < 100 so we would have to use smaller "a" to fit it inside smaller area, therefore we would have to use 5 digits per control point instead of 3 to keep these smaller "a" as precisely defined. So with anything formula the big number would have 23⋅8⋅5⋅30 = 27600 digits. This compression that use of a font offers is crucial to achive self-referentialness. The same trick was used in my 2011 formula where bitmap font was used instead.
Go back to main page on Trávník's smooth self-referential formula.
Back to index - Jakub Trávník's resources.